Madden-Julian Oscillation (MJO)作为冬季热带大气季节内振荡的主要模态,能够通过与背景场(mean state)间的相互作用,激发大气遥相关(简称MJO-teleconnection)可对中高纬地表气温的次季节变率产生重要影响。同时,MJO-teleconnection本身也会受到不同物理因子(如:ENSO,IOD,QBO)年际异常的影响。迄今为止,少有研究关注青藏高原积雪的年际变率对其调制作用。
复旦大学大气与海洋科学系的直博生曹璨在吴志伟教授的指导下,研究了冬季青藏高原积雪的年际信号异常对于东亚地表气温次季节变率的调制作用,揭示了高原积雪如何调控MJO-teleconnection这一关键物理过程。结果表明,东亚地表气温的次季节变率是多尺度间相互作用的结果,高原积雪的年际信号增强,能够使得东亚次季节尺度的地表气温更冷,其对于MJO-teleconnection的调制作用在这一变化中起到了正贡献。同时,数值试验表明波源本身的变化有利于次季节尺度的地表气温降低,而背景场的变化不利于次季节尺度的地表气温降低。
该研究有助于深入理解MJO-teleconnection这一物理过程,研究结果表明考虑高原积雪这一关键下垫面因子的强迫作用,有助于提高中高纬地表气温的次季节预报技巧。
论文于2022年发表在《Climate Dynamics》期刊上。
论文信息:Cao C.,Zhiwei Wu*2022: Modulation of the Tibetan Plateau snow cover on the interannual variations of the MJO-Related winter surface air temperature anomalies over East Asia. Climate Dynamics, DOI: 10.1007/s00382-022-06275-4
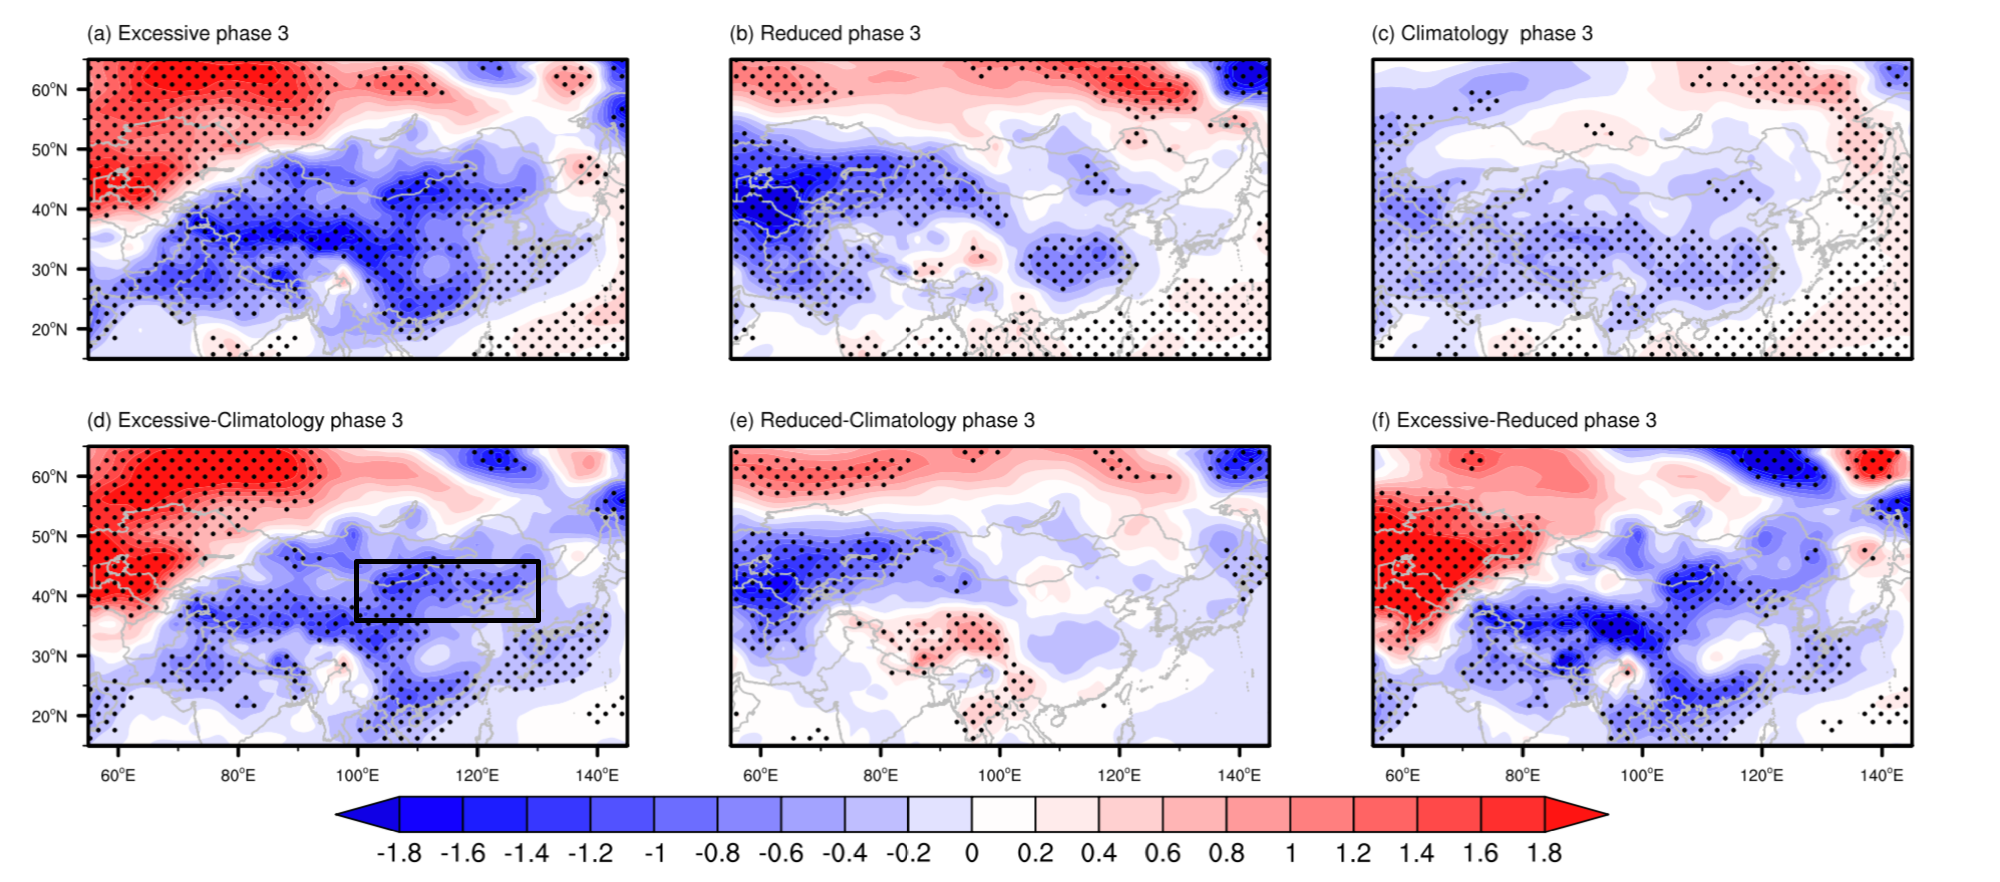
Fig. 1 Composite surface air temperature anomalies (shading, ) in MJO phase 3 for the ETPSC winters (a), RTPSC winters (b) and the climatology (c). The differences between the ETPSC winters and climatology (d), RTPSC winters and climatology (e), and the ETPSC winters and RTPSC (f) winters are shown. Black dots show the significance at the 90% confidence level. The focused region is (35°-45°N,100°-130°E).
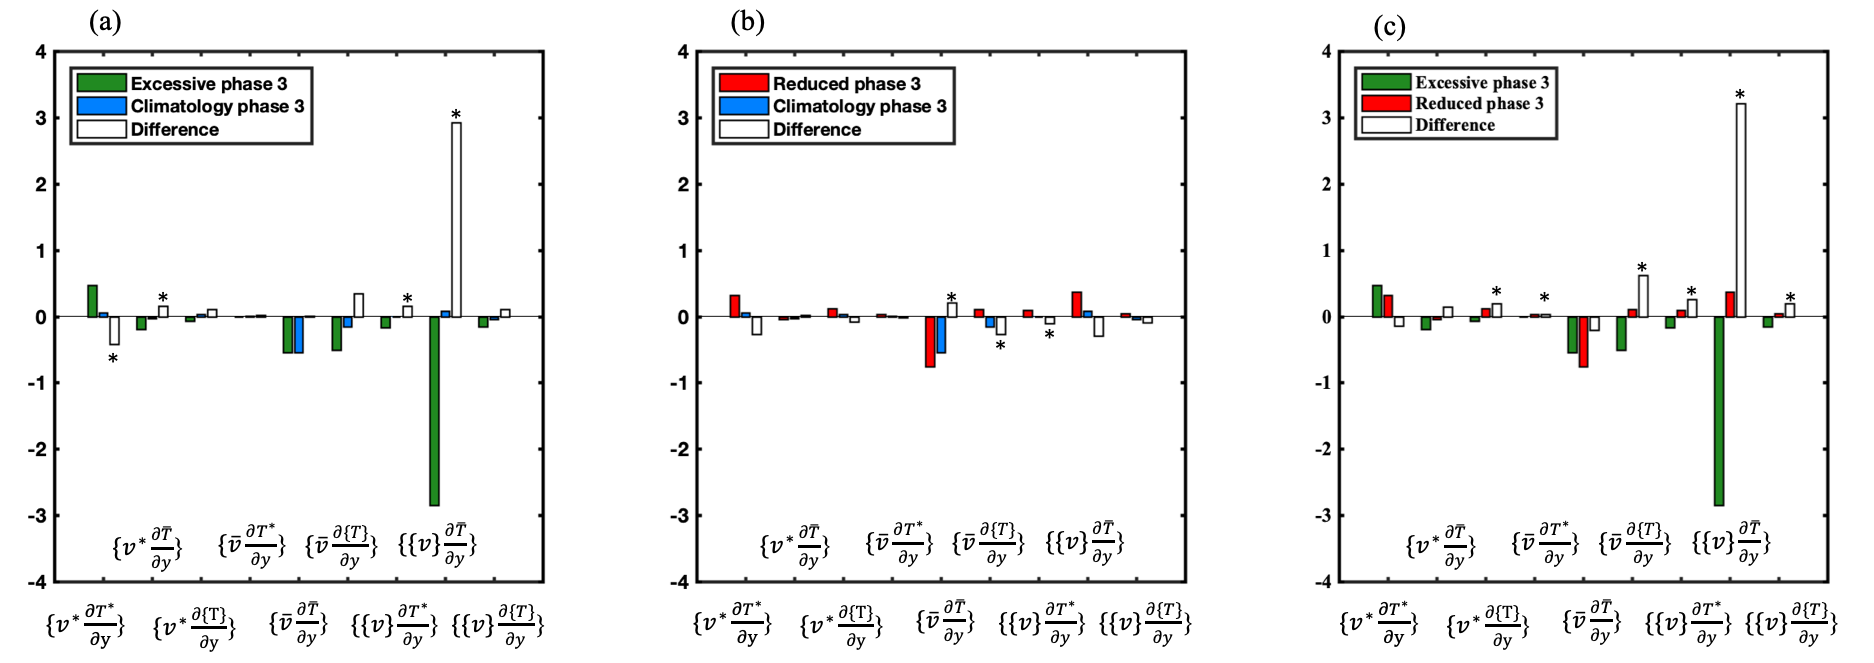
Fig. 2 Individual terms of the meridional advection of the temperature (10-6 K/s) averaged in the box region (35°-45°N,100°-130°E) at 1000 hPa (averaged from day -10 to day 0) for (a) the ETPSC (green), the climatology (blue) and the difference (white) for the MJO phase 3, (b) the RTPSC (red) , the climatology (blue) and the difference (white) for the MJO phase 3, (c) the ETPSC (green), the RTPSC (red) and the difference (white) for the MJO phase 3. The asterisk indicates the difference significant at the 90% confidence level.
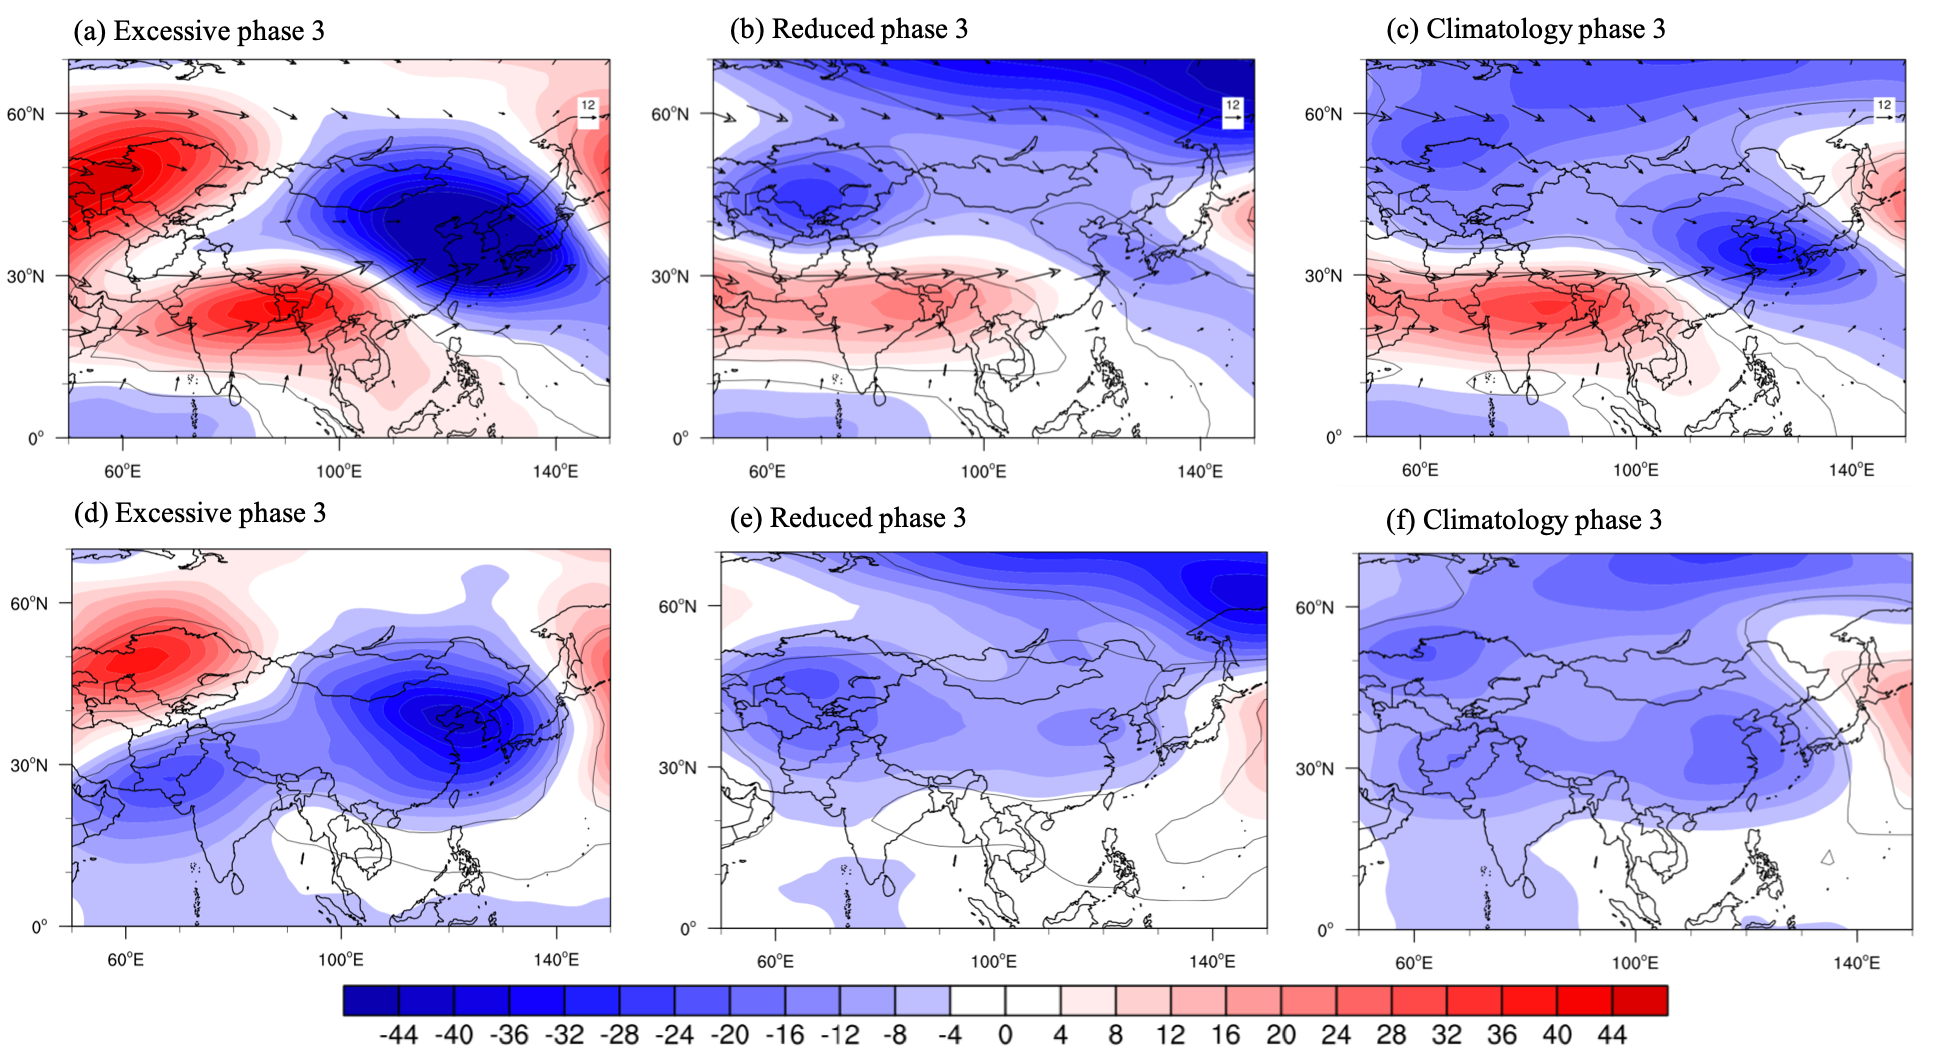
Fig. 3 Composite geopotential height anomalies (shading, gpm) at 200 and 500 hPa in MJO phase 3 for the ETPSC winters (a, d), RTPSC winters (b, e) and the climatology (c, f). The wave activity fluxes (vectors, m2/s2) at 200 hPa are also shown. The curve shows the geopotential height anomalies significant at 95% confidence level.