降水是青藏高原水循环过程的重要一环,准确的降水数据对于理解陆气相互作用和区域水资源管理至关重要。然而,获取高原上准确的降水数据至今仍然是一大挑战。高大陡峭的地形和恶劣的环境使得观测设备难以建立、维护,高原上站点分布稀疏不均,无法获得高质量降水观测数据。而且,一些研究指出全球气候模式对高原降水的模拟存在显著高估。随着计算机水平的快速发展,公里级别的对流允许尺度模拟逐渐进入大家的研究视野,精细的地形描述和对流过程的显示解析使其在降水模拟中存在优势,那么其在高原上将表现如何呢?
为了更好地描述高原夏季降水的时空分布特征,复旦大学大气与海洋科学系高艳红教授研究团队开展了对流允许尺度模拟(4 km,CPM)和动力降尺度模拟(28 km,DDM)。首先,他们以站点观测为准,综合评估了两套降水模拟数据和四套降水网格数据(APHRODITE、GPM、ERA-Interim和ERA5)在高原上的性能;然后以降水日变化特征为重点,从水汽输送和对流能量角度解释了模拟数据(CPM,DDM)与再分析资料(ERA5)的差异;最后,通过分析湿对流不稳定度条件,深入挖掘降水日变化差异的物理机理。
研究表明,这6套数据在降水量上存在较大差异,这些差异主要由降水频率引起。其中APHRODITE和GPM的结果与站点观测最接近,而两套再分析资料表现出严重的降水高估,且ERA5中降水日峰值过早过强,与观测严重不符,这与其较强的水汽输送和过早出现的强CAPE峰值有关。DDM和CPM对降水的模拟显著优于再分析资料,尤其是CPM在降水日变化中表现出明显优势:它能够更准确地表示出高原夏季降水在下午较晚时刻到夜间的峰值(1500-2400LST),而DDM则表现出较早的下午峰值(1500-1600LST)。进一步研究发现,DDM中大部分站点/格点湿对流不稳定度比CPM大,使得其对流触发过早过强,导致了DDM中较早的下午峰值。
该研究揭示了公里尺度在高原降水模拟中的显著优势,提出高分辨率模拟改进青藏高原降水模拟机理的新思路。硕士生刘朝阳同学为第一作者,高艳红教授为通讯作者。该文章于2022年1月发表于Climate Dynamics。
Liu Z, Gao Y, Zhang G, 2021: How well can a convection-permitting-modelling improve the simulation of summer precipitation diurnal cycle over the Tibetan Plateau? Clim Dyn,10.1007/s00382-021-06090-3.
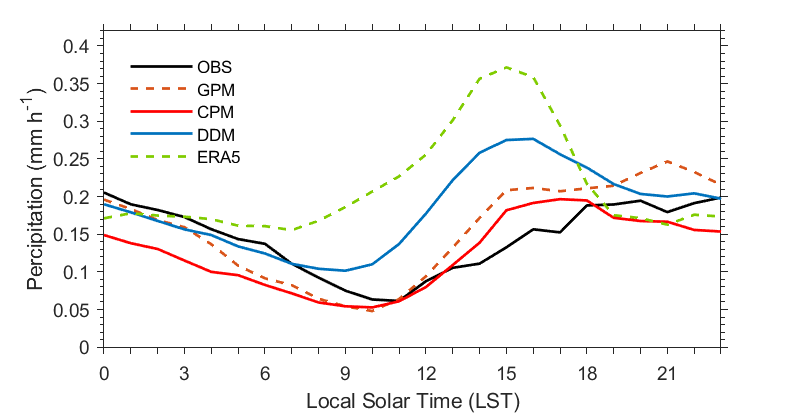
Fig. 1 Diurnal variations of summer mean precipitation averaged over 83 CMA stations on the TP among OBS, GPM, CPM, DDM and ERA5 (units: mm/h). The black solid line indicates the results of in-situ observations; the orange dashed, red solid, blue solid and green dashed lines indicate the values at the nearest 0.25° grid cell to the CMA stations in GPM, CPM, DDM and ERA5, respectively
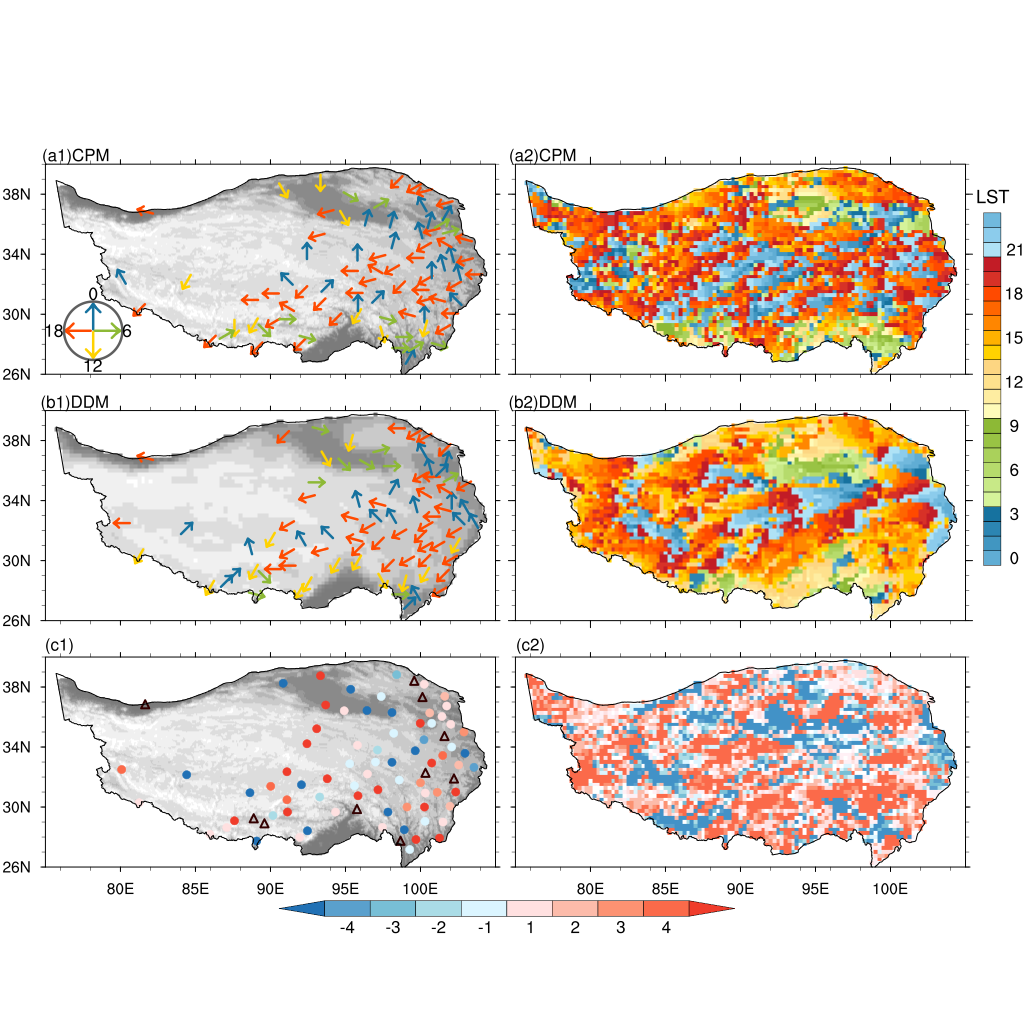
Fig. 2 Distributions of the precipitation diurnal peak time (LST) in June 2014 at 83 CMA stations (left) and grid cells over the whole TP for (a1–a2) CPM and (b1–b2) DDM. Differences between CPM and DDM are exhibit in panel (c1–c2). The red dots in (c1) represent that the precipitation diurnal peak of CPM at this station is later than that of DDM. The blue dots represent that CPM has an earlier precipitation peak time than DDM. Stations with the same peak time in the two simulations are represented by black triangles.
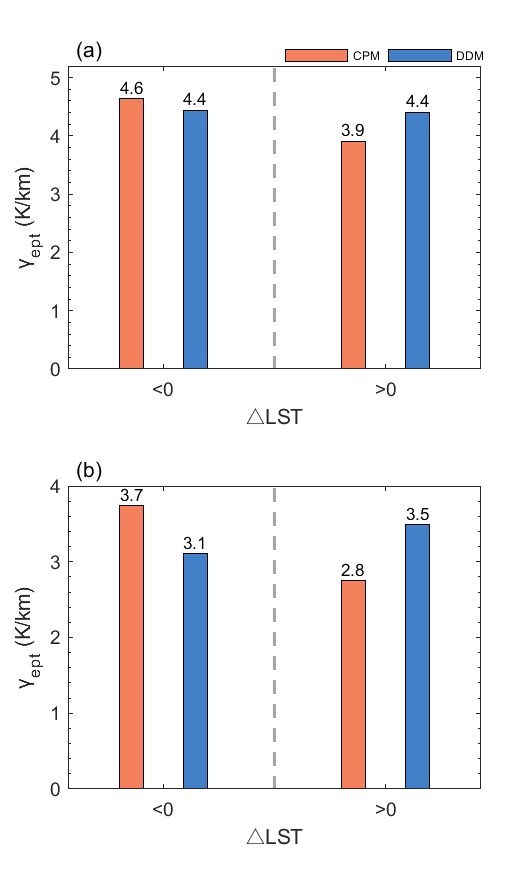
Fig. 3 The vertical equivalent potential temperature rates of decline (γept) during 0900LST to 2100LST in the lower atmosphere (unit: K/km) for the two types of stations/grids in red and blue in Figs.2 (c1–c2). For the left (right) -hand side of the gray vertical dot line, △LST<0 (>0) denotes an earlier (latter) precipitation diurnal peak in CPM than DDM, which correspond to blue (red) in Figs.2 (c1–c2)